Information visualisation
World Values Survey
An interactive map visualising what people around the world think is important in life, built with D3.js.
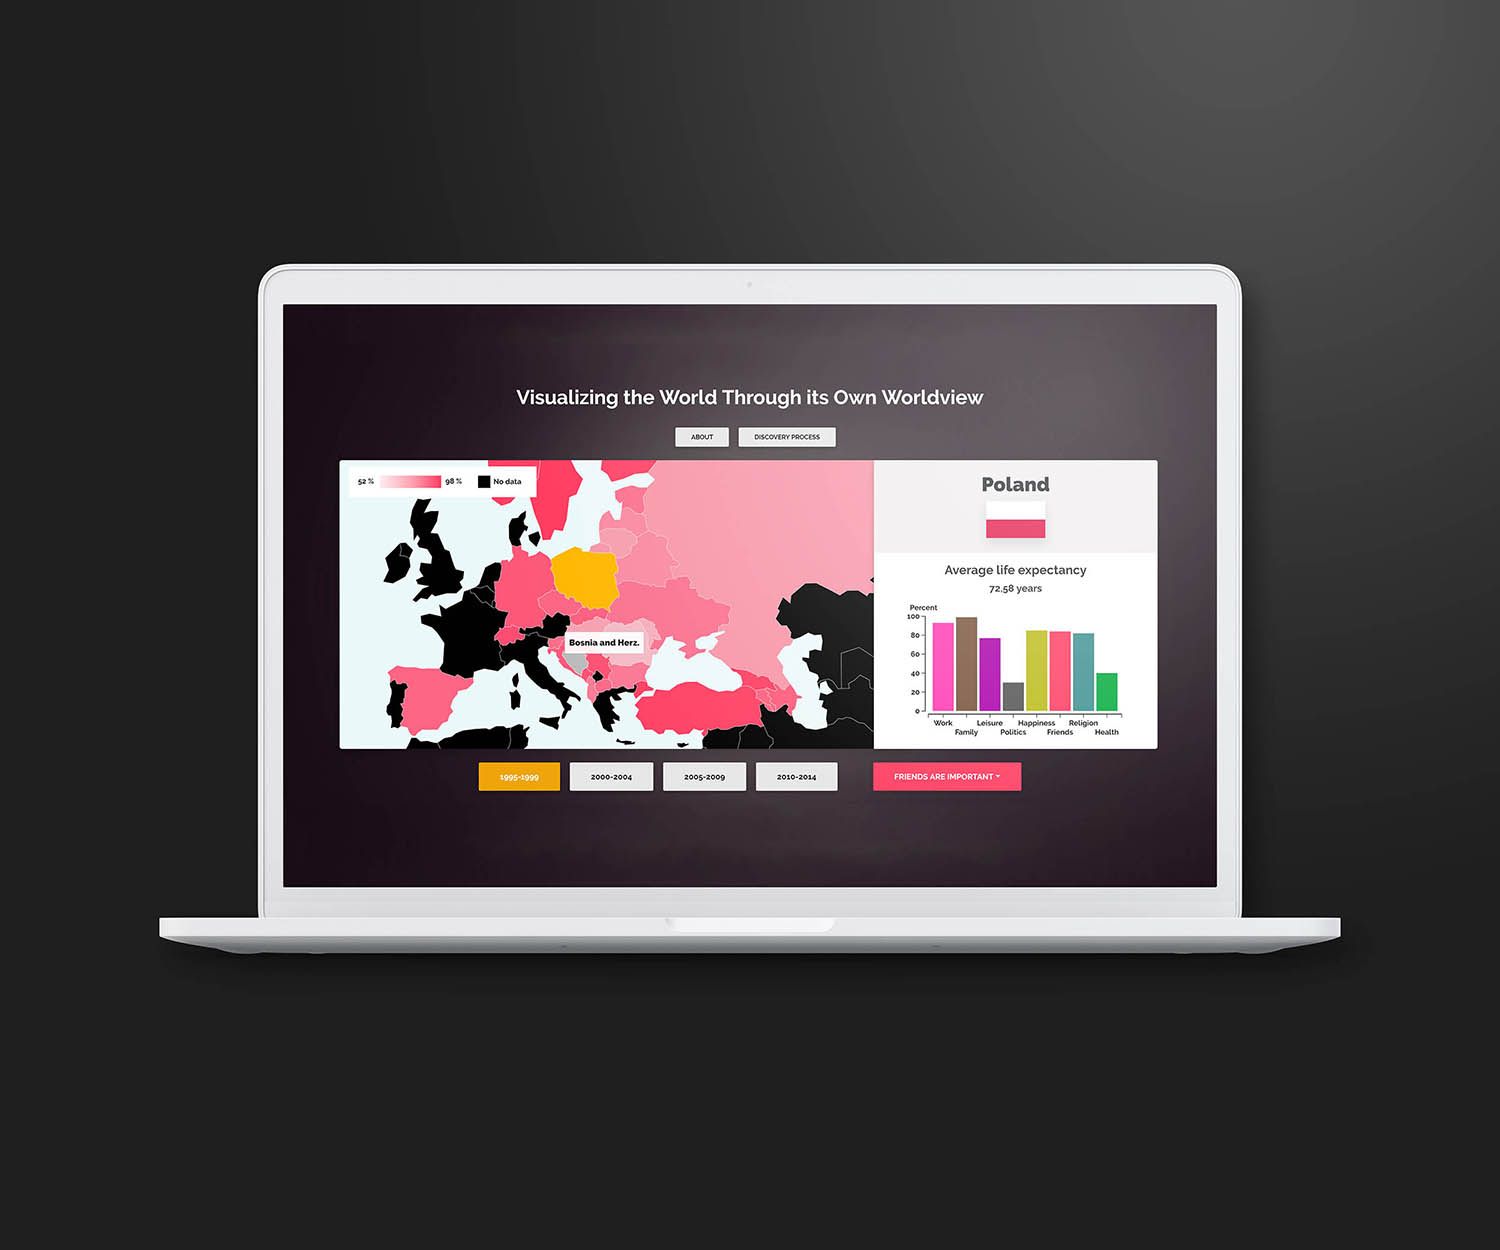
An individual project from the course Information Visualization (DH2321) at KTH, covering the information visualisation pipeline from data structuring to visual mapping, as well as human perception.
The visualisation uses data from the World Values Survey and Gapminder about what people think is important in life — religion, work, family and more. Each category is encoded with a colour; when a category is selected, each country's fill updates to show the share of people who consider it important for the chosen period. More saturated colour means a higher percentage. The design leans on preattentive features such as colour, position and size to help users gain insights faster.
The application is designed for desktop browsers.